

PRB Mudweights & Shows
The mudweight and shows database contains 1800+ data points from 315 well locations. To build the dataset we reviewed mudlogs for mudweight values and the mudloggers annotations of cut, fluorescence, gas kicks, flares and oil on the pits. The team made comments about each show and also subjectively classified them based on all of the data reviewed in the basin. The data come as a series of raw data points, gridded values and specially formatted data tables. The raw data and grids can be used in Petra, Petrel, ArcGIS and many other geospatial programs. The package contains preformatted files for input as zone items or interval items in programs such as Petra.

Gridded Data
We gridded numerical data using the Kriging algorithm in Golden Software's Surfer. The kriging method is excellent in cases where spatial data are irregularly spaced. We then reviewed each grid with respect to the basin context and edited the grids based on data quality and density.

Key Cretaceous Intervals
Mudweight values were determined for key intervals using a proprietary set of stratigraphic tops. We assigned mudweights to key formations where weight measurements were recorded within a reasonable vertical distance of the formation of interest. Key intervals range from the Teapot to the Dakota with data in carbonate, shale and sandstone formations.
Data Tables
Data tables are organized so the data can easily be imported, mapped or assigned to a depth in a multitude of programs. Where applicable, there are also associated loader files so that imports are fast and simple.
PRB Maturity & XRD
The maturity and XRD dataset contains measurements from 3529 samples from 263 locations. The data are from a variety of laboratories and span several decades of analytical work. The geochemistry team that compiled this data set recorded the lab and instrument that did the work (where available). Furthermore, the team reviewed each data point and annotated inconsistencies between data of different vintages or labs in the same well. Where an possible, an opinion on the most reliable values are also annotated.

Maturity Grids
To create the grids, we dropped erroneous data from the set and we krigged average values by source rock formation. The kriging methodology accounts for irregular spatial distribution and individual grids were edited for data quality and basin history.

Grid Colors by Kerogen Kinetics
We symbolized the grids based on generation rate and kerogen kinetic differences in disparate formations. The same color bar is used across data sets to represent similar percent conversion at differing maturity values.
Data Tables
The maturity and XRD data tables contain sample provanance information such as sample type (core vs cuttings) analytical instrument (Rock-Eval, SRA, HAWK, LECO, etc.) and laboratory. With this information, a better interpretation can be made where multiple data vintages are present.
PRB Permeability & Porosity
The porosity and permeability data set contains thousands of data points from hundreds of wells. The data cover the Sussex, Shannon, Parkman, Turner, Frontier, Codell, Wall Creek, Muddy and Dakota formations. The data can be purchased as a complete set or by formation. Most of the data come from conventional core analysis on plugs from whole core but some analyses are on sidewall cores and crushed rock. Many samples have saturation data and grain density data. The data are annotated with the lithology of the plug samples, the type of mud used in drilling, as well as the laboratory that analyzed them. Where possible, log curves have been digitized and the values from the digital curves are available in the data tables for petrophysical calculations.
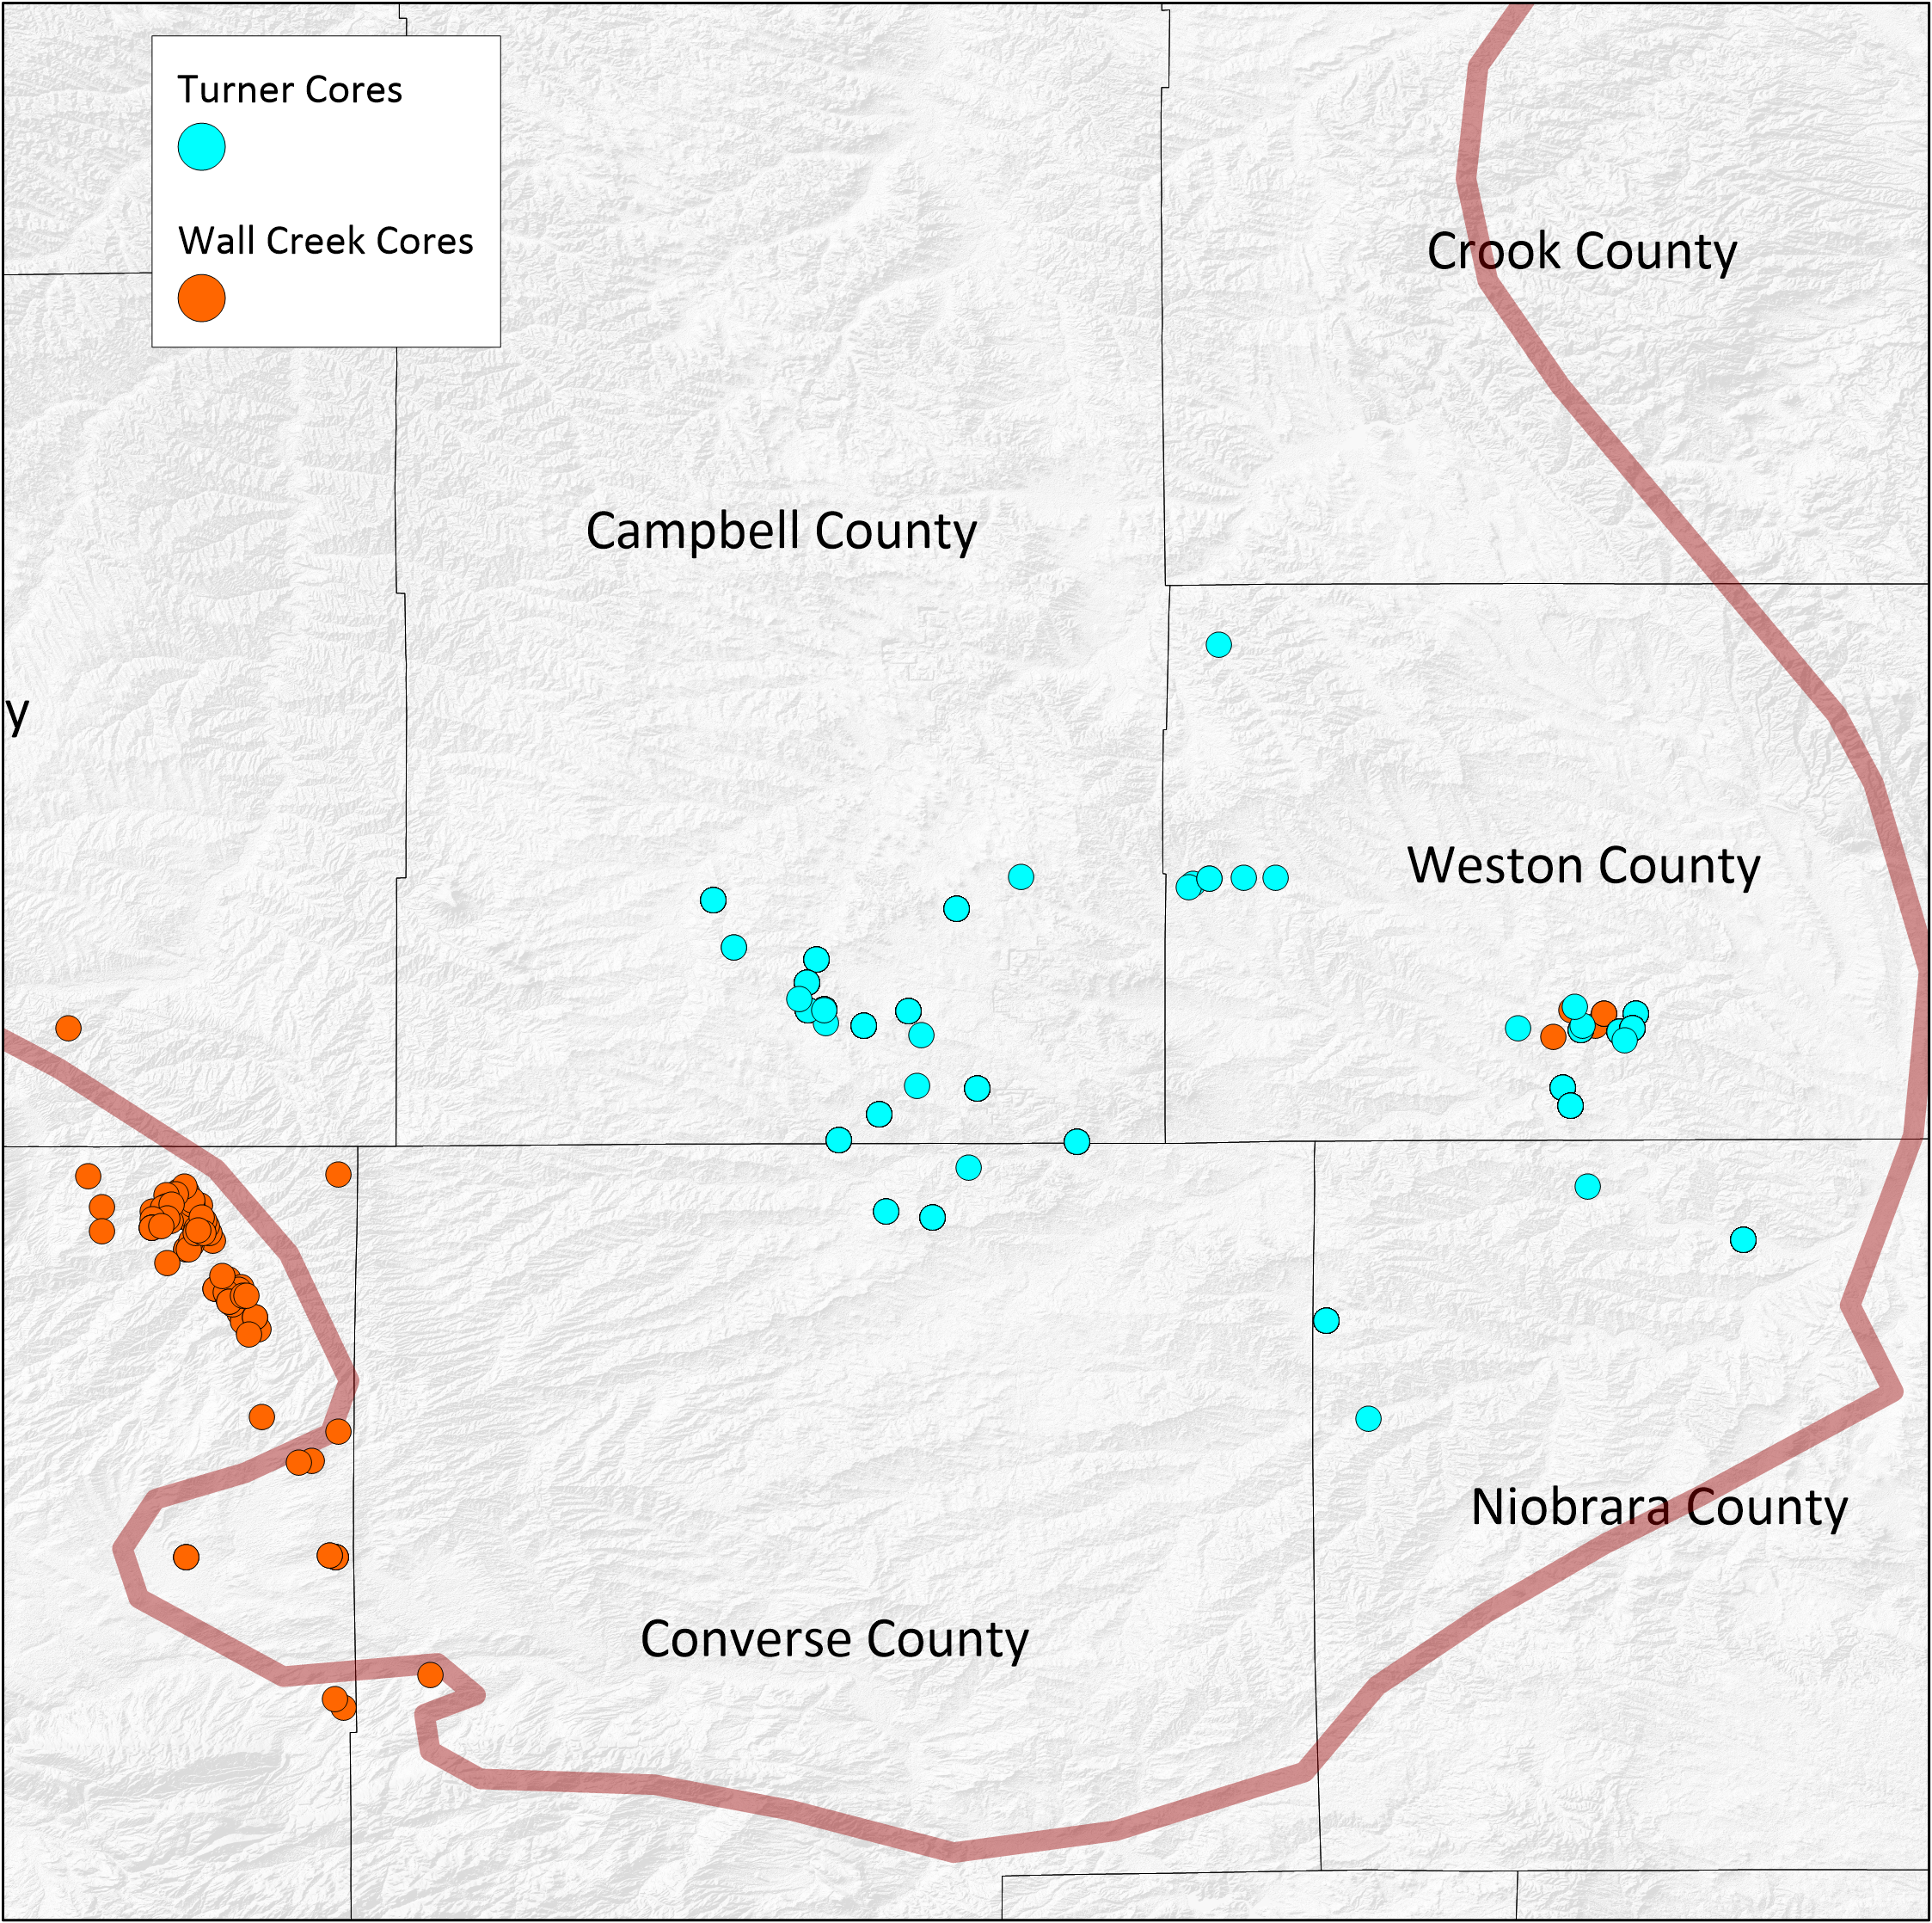
TURNER Data Locations
Data are available from 24 locations in Campbell, Converse, Niobrara and Weston counties. These samples, especially in Campbell and Converse counties are in the core of the Turner play.

Core to Log relationships
The inclusion of well log values and lithology allow for quick petrophysical and facies interpretation from cross plotting and cross section creation. Soon, a depth registered core image dataset will be available for even deeper interpretation
Data Table
The data table contains core measurements as well as critical information such as lithology and analytical laboratory for nuanced interpretation. The data tables also contain well log values from digitized curves where available.
PRB Tops
Operators Tops
We started with the state database of tops provided by operators and did a quality assessment from trend surface analysis of the gridded data. This procedure removed extreme outliers and left all tops within a 100 ft interval of the trend surface. Remaining tops were spot-checked against well logs by township and are what we deliver in this dataset. While it is not a perfect set of picks, it is consistent enough for regional work and basin model creation. This dataset contains several thousand tops for each formation from Tertiary to Paleozoic.
Lithostratigraphic Tops
Lithostratigraphic tops were selected at minimum for one well per township. Each top comes with a pick description relating log character to stratigraphic nomenclature. The geology team did multiple quality assurance procedures, including loop ties and regional cross sections. This dataset is the best starting point for detailed stratigraphic analysis in the basin.
Sequence Stratigraphic Tops
This set of tops is based on shale resistivity markers and regional stacking patterns. Multiple regional datums were selected by correlating bentonite beds. The dataset includes regional shale resistivity markers as well as sequence stratigraphic markers tied to lithostratigraphic formation names. Tops have been picked on a regional basis, typically one detailed well every few townships. This dataset is the most accurate for regional relationships in tight sand reservoir systems.